
Analyzing Listing Price Changes in BC from September 19 to September 26, 2024
Sept. 26, 2024 byA Data-Driven Exploration of Recent Real Estate Price Movements and Trends
Introduction
To explore the potential impact of the recent mortgage-free firms, we have analyzed listing activity in British Columbia from September 19, 2024 to September 26, 2024. This builds on our previous analysis of the period from September 11, 2024 to September 19, 2024, allowing us to compare trends across the two weeks. By examining these periods side by side, we can assess whether the price changes follow a similar pattern or show significant differences, shedding light on how the market is reacting.
Shifts in Price in BC
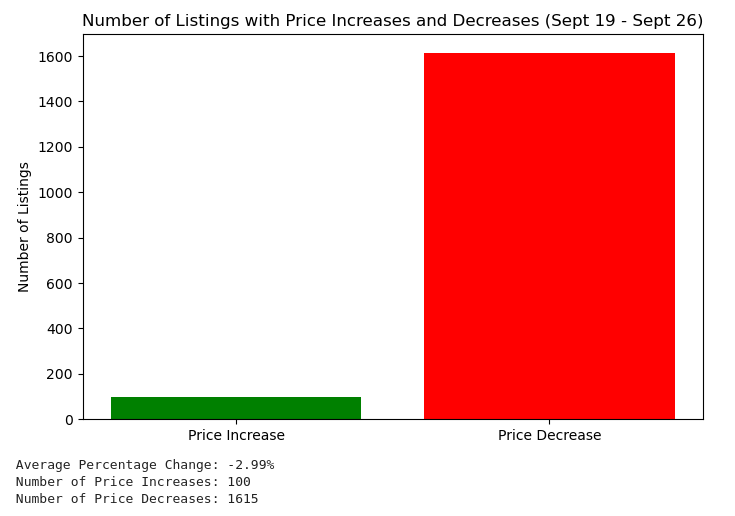
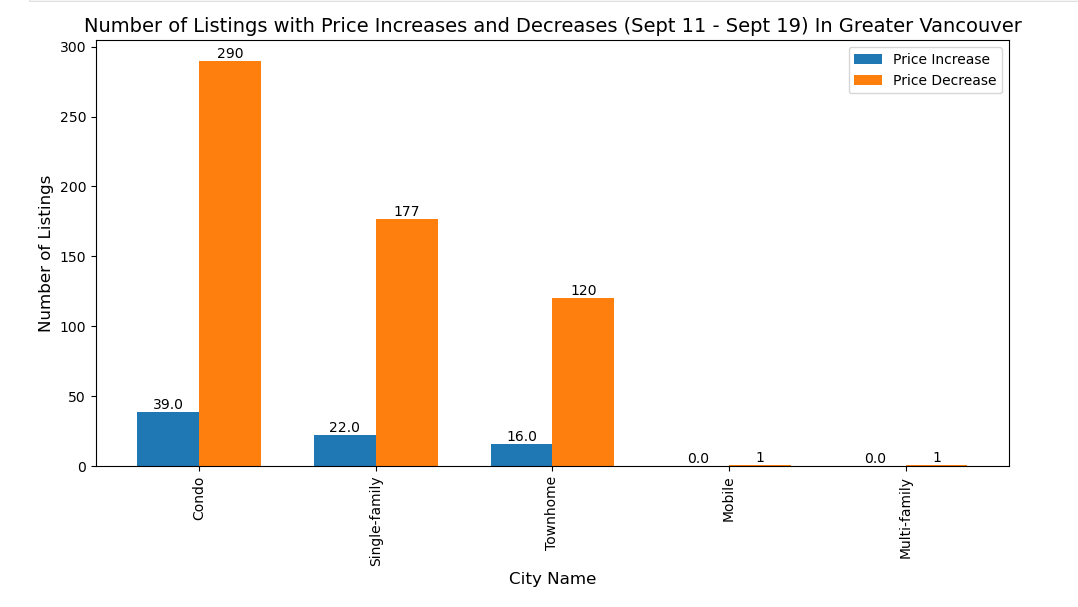
Out of 34,487 active listings, 1,715 listings saw a price change. Notably, most of these changes were price decreases. A detailed breakdown of the number of price increases and decreases can be seen in the bar chart below.
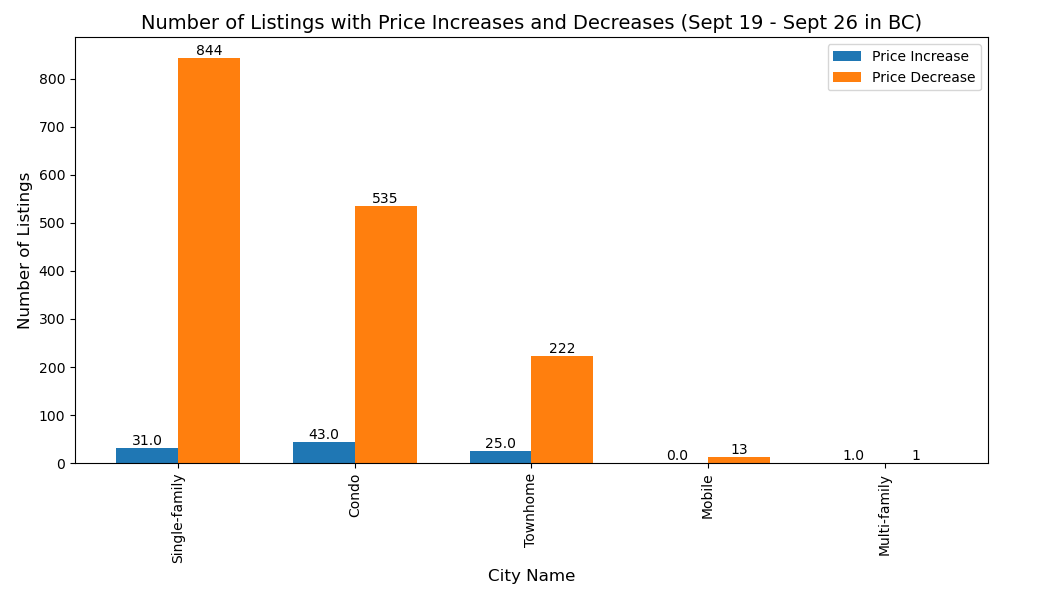
To provide further insights, we’ve also broken down the data by property type, showing the number of price increases and decreases for each category.
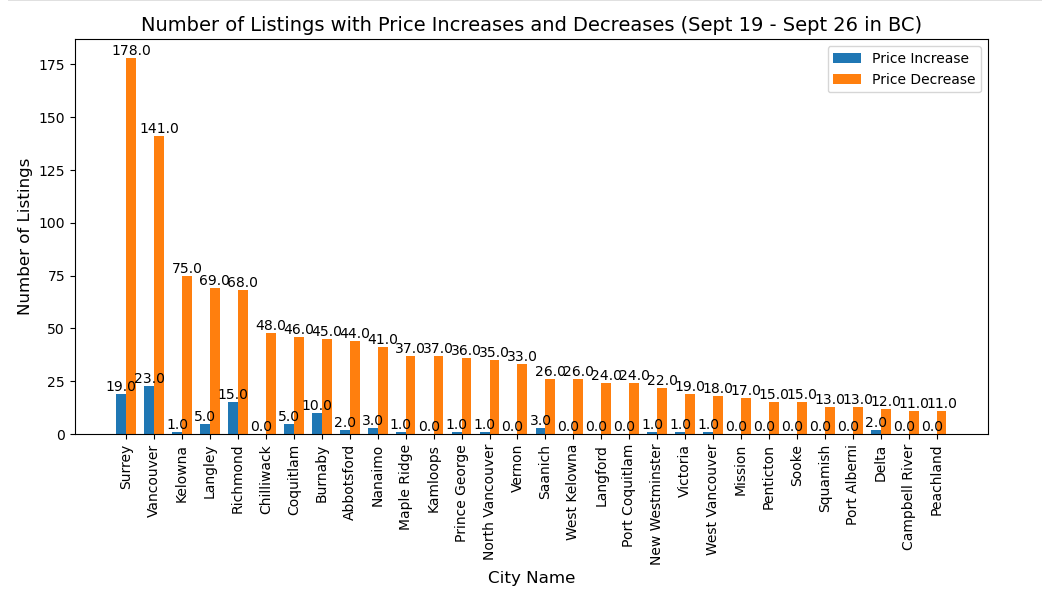
Next, we analyzed the price fluctuations by city to gain a deeper understanding of regional trends. Specifically, we focused on the top 30 cities that had the highest number of price decreases during the observed period.
Percentage of Price Changes by City
Before diving into the percentage changes in listing prices, it’s essential to address the presence of outliers—properties with extreme price fluctuations that can distort our analysis. To ensure greater accuracy, we will first identify and analyze these outliers.
-
Outlier Analysis: We will examine properties with significant price increases and decreases in each city. A bar chart will display the number of outliers in each city, providing insight into the distribution of these extreme cases.
-
Outlier Breakdown: Additionally, a table will highlight the specific streets where these outliers are located, along with the property type and the nature of their price changes. This transparency will clarify which properties were excluded from our main analysis to maintain accuracy.
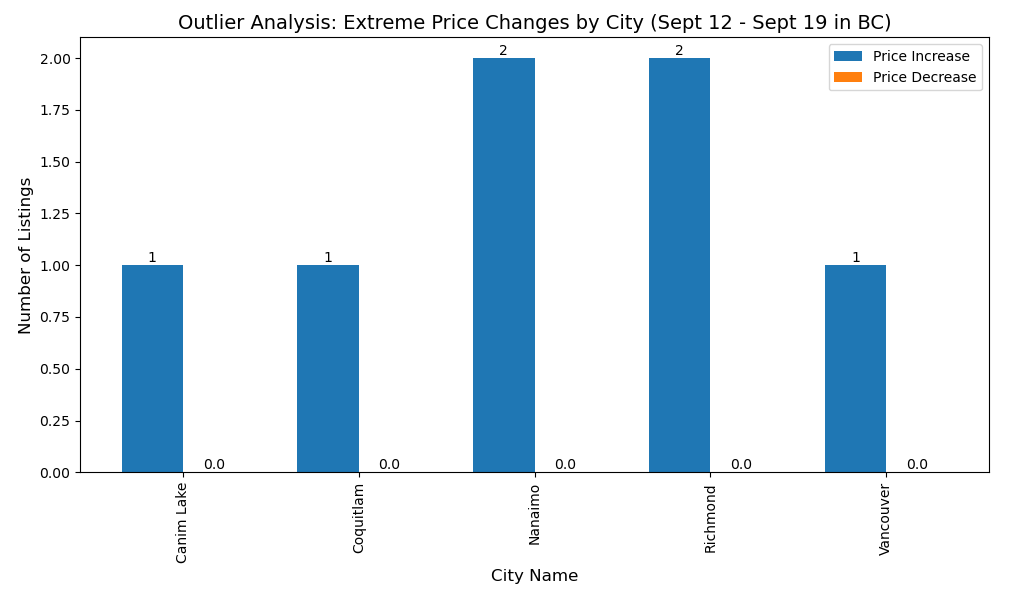
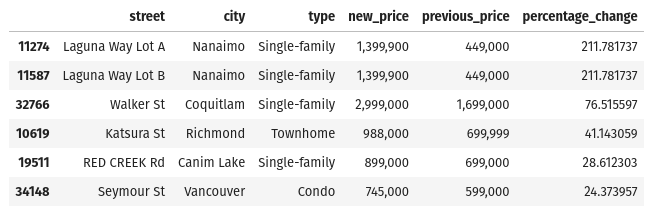
As it can be seen, in the case of the decreasing trend, no outliers were identified, indicating a consistent pattern across the board. However, for the increasing trend, we did observe a few outliers, which may influence the overall growth rates.
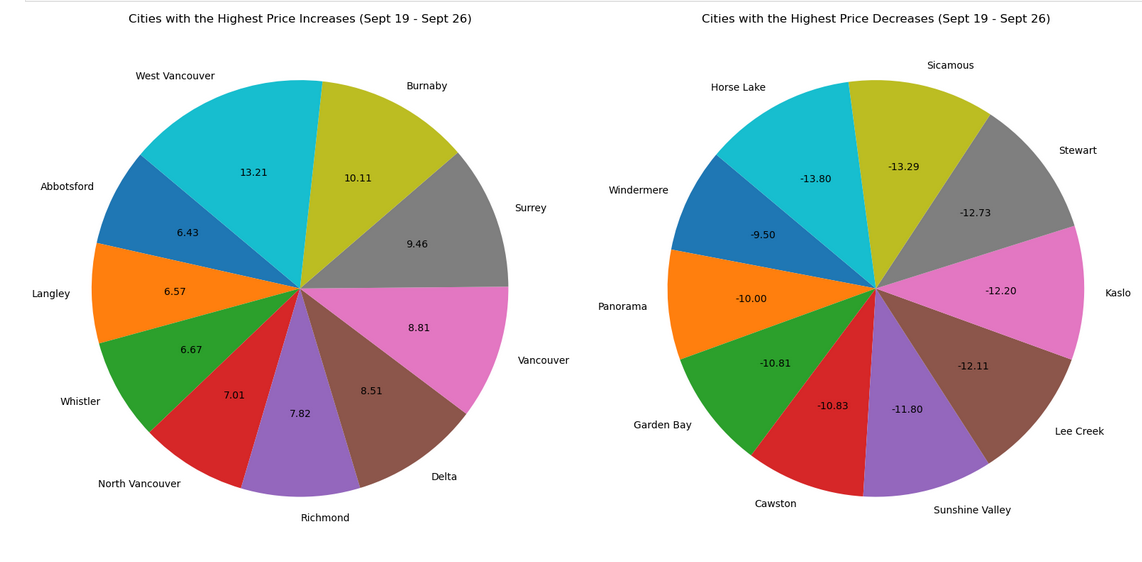
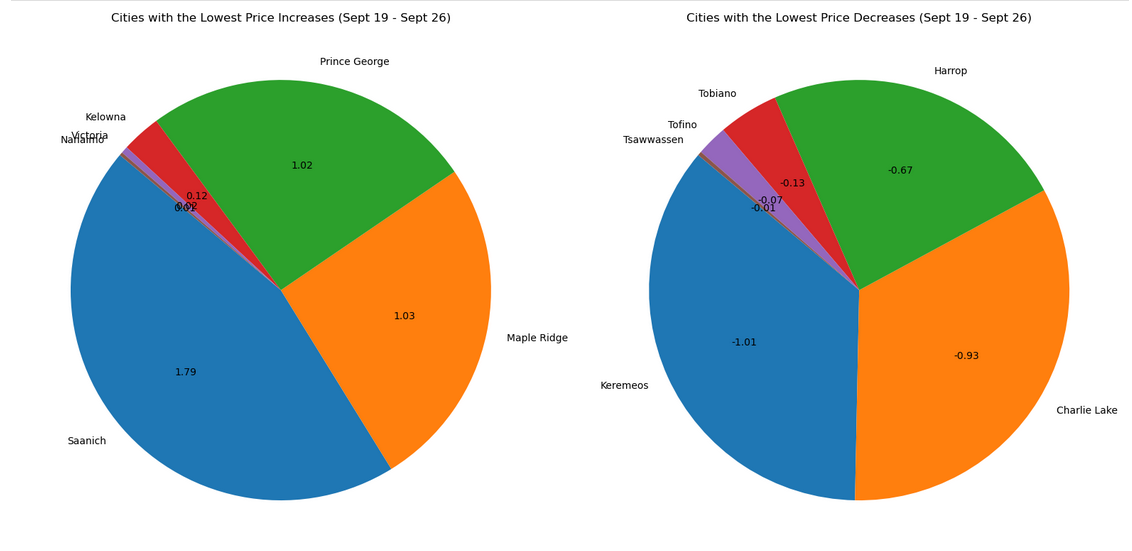
Now in the next four charts, we focus on highlighting the cities with the most significant percentage changes in listing prices. We display two separate charts for the top cities with the highest price change and the cities with the lowest price change in listing. Similarly, for price decreases, we present the cities with the largest and smallest drops.
The properties categorized as outliers will not be used in the pie charts for price trends, ensuring that the final analysis is more accurate and reflective of the general market. Removing these extreme cases allows us to focus on the more consistent trends across BC property listings.
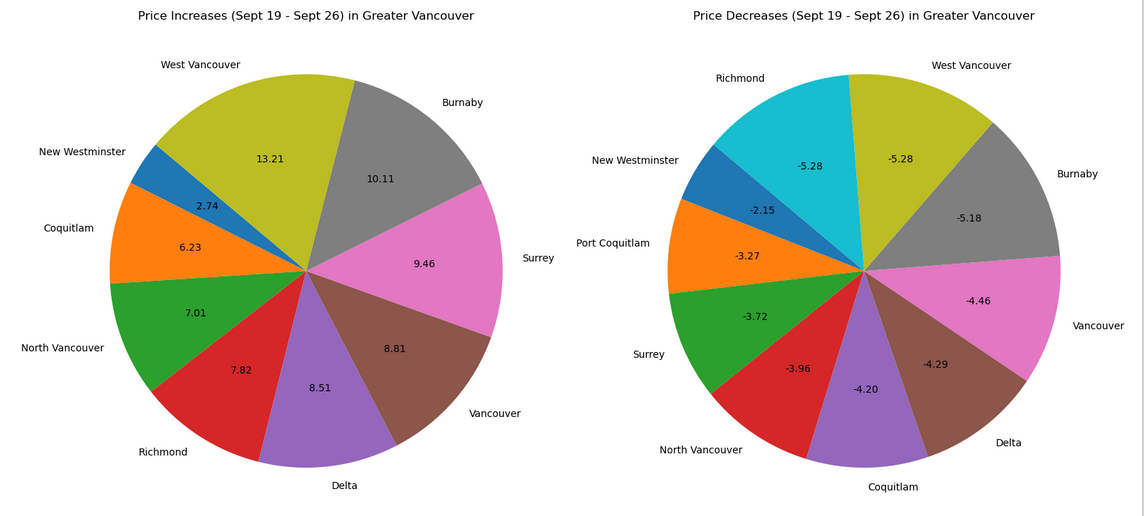
Price Trends in Greater Vancouver: A Focus on Key Urban Areas
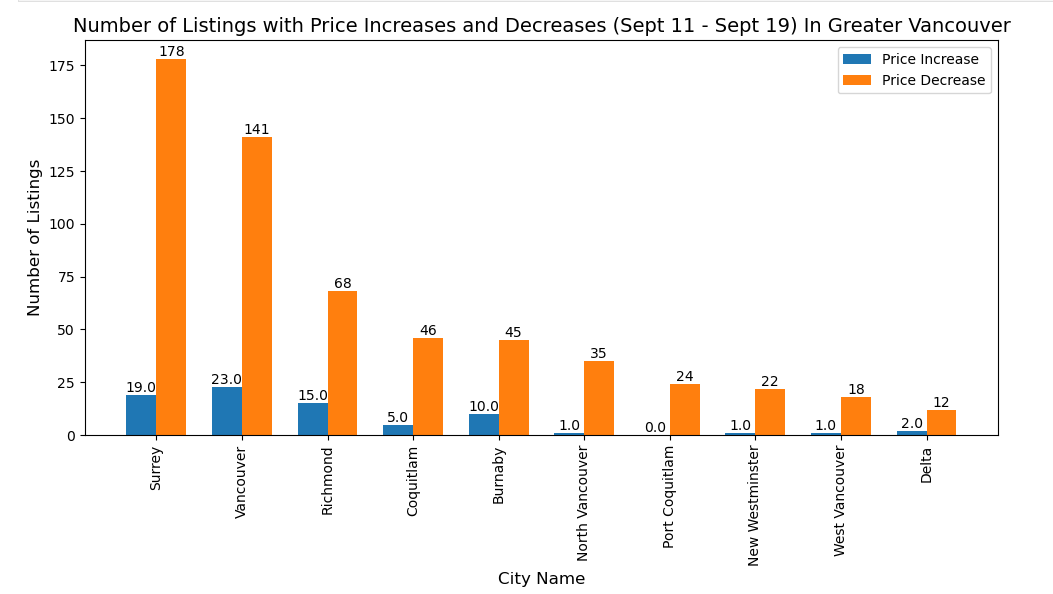
Next, we shift our analysis to Greater Vancouver, focusing specifically on key cities such as Vancouver City, Burnaby, Richmond, Coquitlam, Delta, New Westminster, Port Coquitlam, North Vancouver, and West Vancouver. In this section, we will explore the percentage changes in listing prices across these cities, providing a clearer picture of how price trends changed in this urban region
Conclusion:
In conclusion, while the overall trend continues to show a decrease, the growth percentage for increasing listing prices has gone up this week. West Vancouver, in particular, stands out with the highest increase in listing prices. Despite the decreasing trend overall, we observed a noticeable rise in the growth percentage for increasing prices across all other cities, while the percentage of decreases remains similar to last week.
If you have any further questions or are curious about specific trends, feel free to leave a comment below. I'll be happy to dive into the data and provide answers.


Or