
How Canada’s New Mortgage Reforms Are Shaping Real Estate Listings and Prices
Sept. 19, 2024 byTracking real estate listing price trends through data analysis
Introduction:
In an effort to make homeownership more accessible, especially for Millennials and Gen Z, the Canadian government recently introduced sweeping mortgage reforms. These changes, which came into effect on August 1, 2024, are designed to make mortgages more affordable for first-time homebuyers and help Canadians overcome the significant hurdle of hefty down payments. As the housing market adjusts to these new policies, we’re beginning to see shifts in property listings and prices across the country. In this blog, we’ll explore how these changes are impacting the real estate landscape.
Summary of the Key Mortgage Reforms:
To set the context, let’s first summarize the key aspects of the new mortgage rules:
- 30-Year Mortgage Amortizations for First-Time Homebuyers: This rule extends the period over which first-time homebuyers can repay their mortgages, reducing monthly payments and making homeownership more affordable.
- Insured Mortgage Cap Increase: The cap for insured mortgages will be raised from $1 million to $1.5 million, reflecting the higher cost of homes in cities like Vancouver and Toronto. This allows buyers to qualify for mortgages with lower down payments on more expensive properties.
- Switching Lenders Without Stress Tests: Insured mortgage holders can now switch lenders without undergoing another stress test, increasing competition and allowing homeowners to secure lower interest rates.
- Encouragement of New Builds: Expanded eligibility for 30-year mortgages also applies to new builds, aiming to boost the supply of homes and alleviate the ongoing housing shortage.
Analyzing the Impact on Listings and Prices
To explore the potential impact of the recent mortgage reforms, we looked at listing activity from September 11 to September 19, 2024. This time period gives us an early glimpse into any shifts in pricing trends and overall market dynamics.
Change in Listing Prices in BC
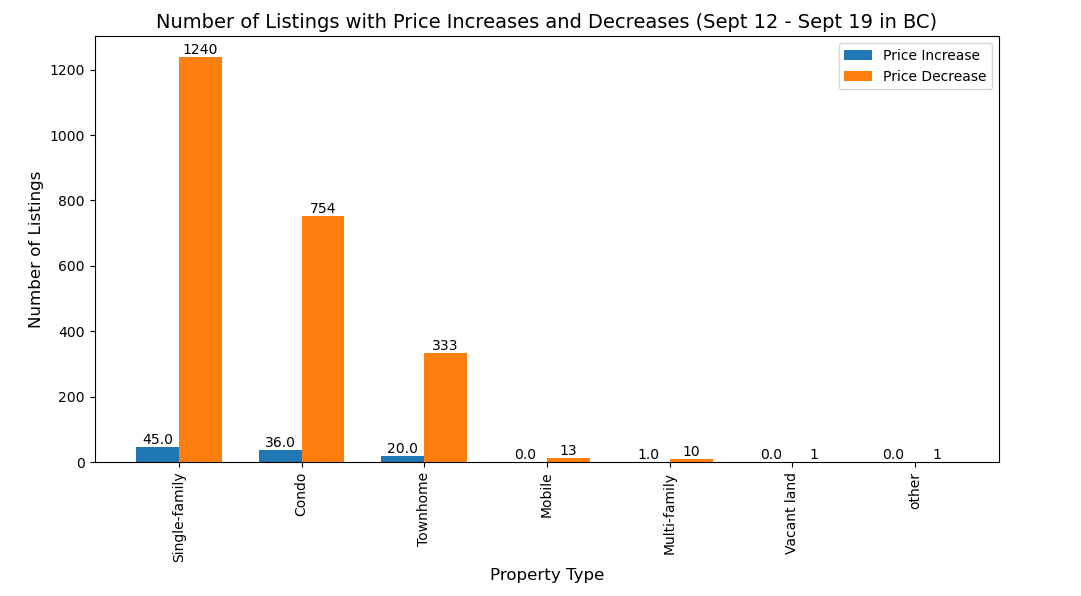
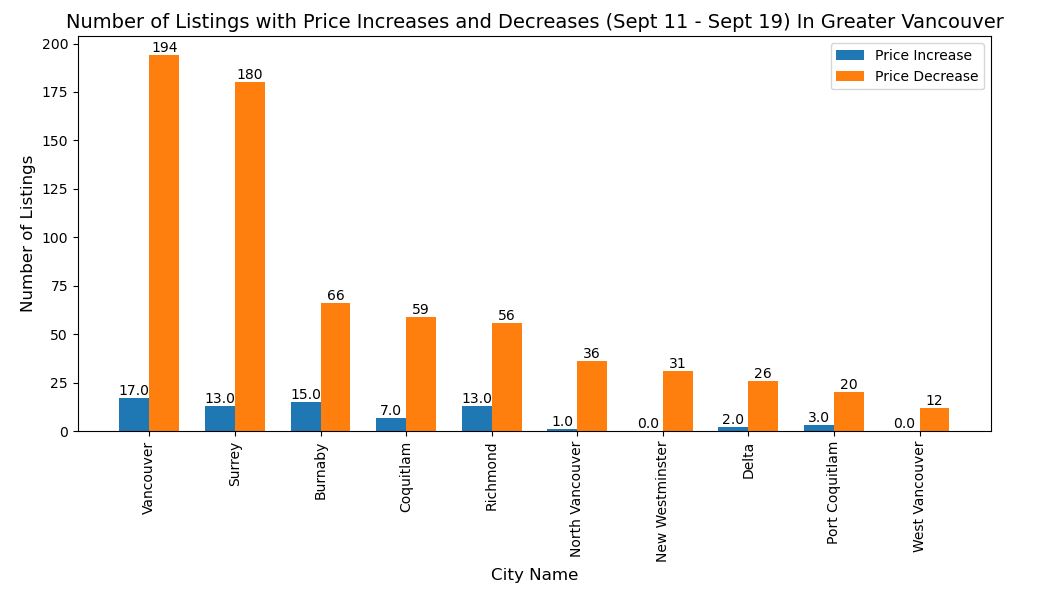
Out of 33,925 active listings, 2,454 listings saw a price change. Notably, most of these changes were price decreases. A detailed breakdown of the number of price increases and decreases can be seen in the bar chart below.

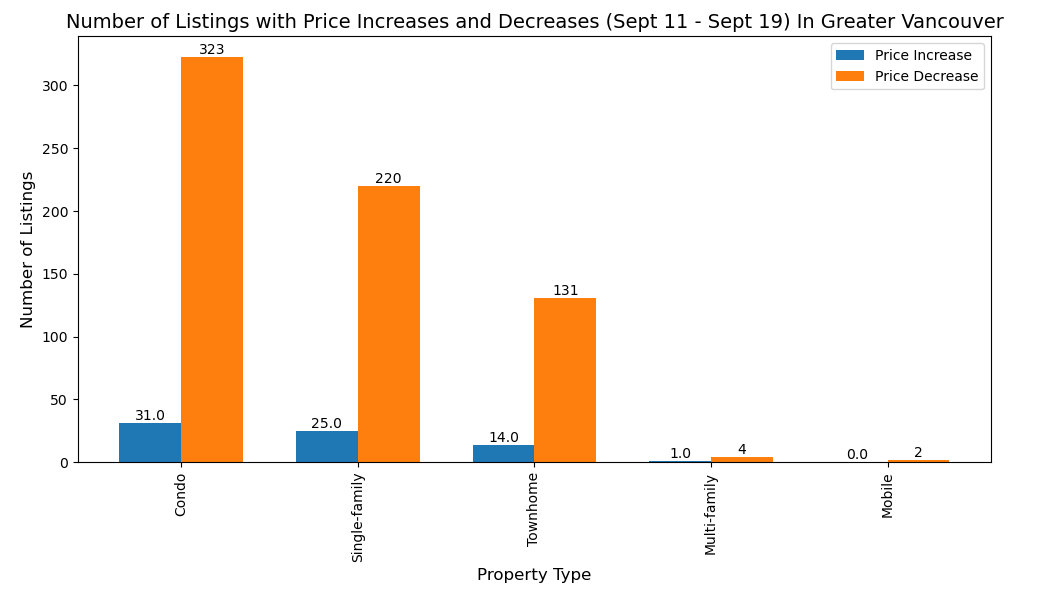
To provide further insights, we’ve also broken down the data by property type, showing the number of price increases and decreases for each category.
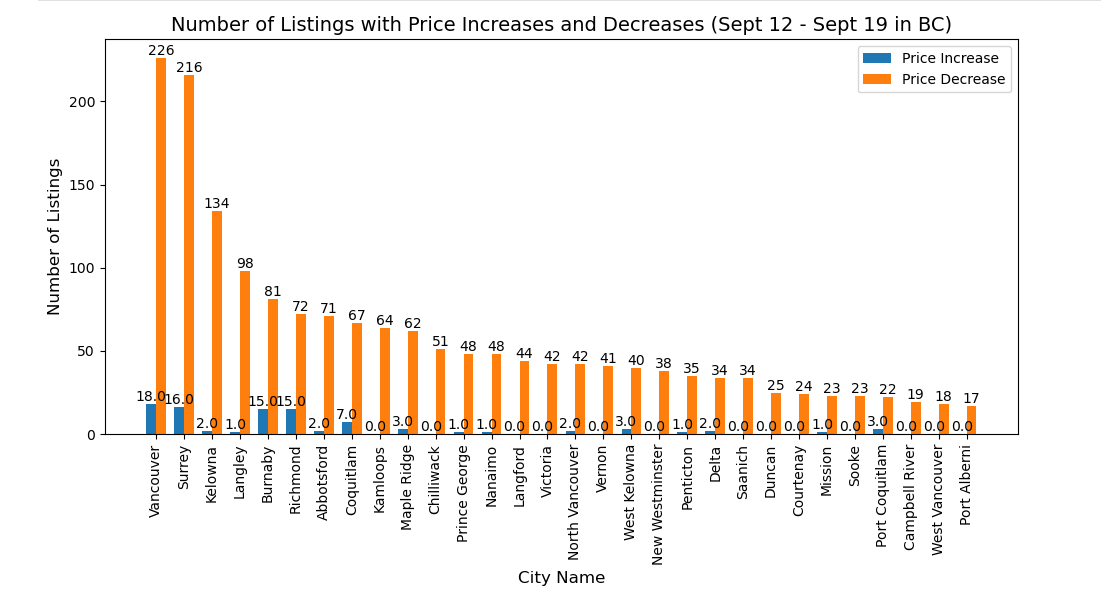
Next, we analyzed the price fluctuations by city to gain a deeper understanding of regional trends. Specifically, we focused on the top 30 cities that had the highest number of price decreases during the observed period.
Percentage of Price Changes by City
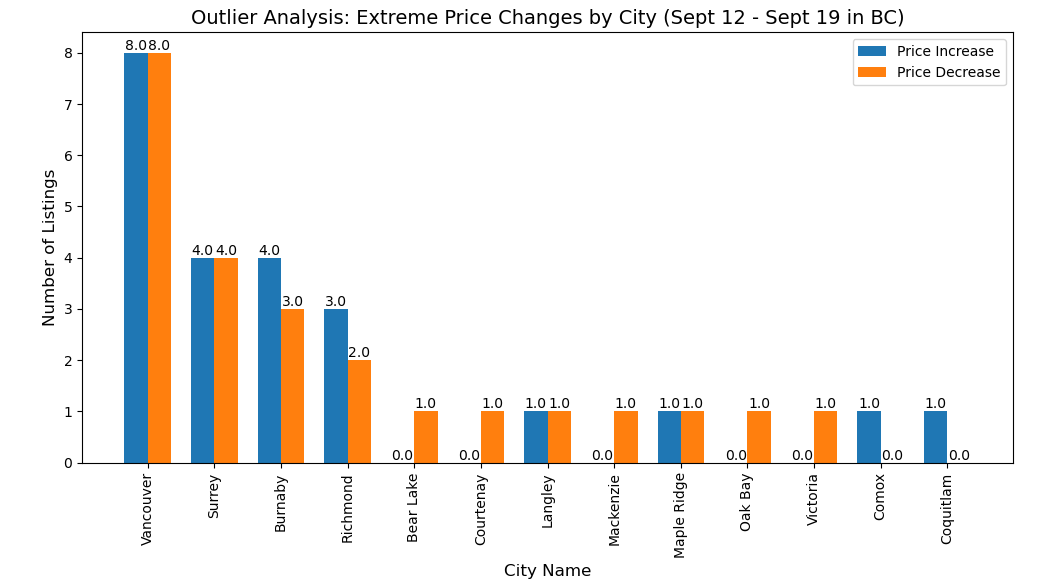
Before diving into the percentage changes in listing prices, it’s essential to address the presence of outliers—properties with extreme price fluctuations that can distort our analysis. To ensure greater accuracy, we will first identify and analyze these outliers.
-
Outlier Analysis: We will examine properties with significant price increases and decreases in each city. A bar chart will display the number of outliers in each city, providing insight into the distribution of these extreme cases.
-
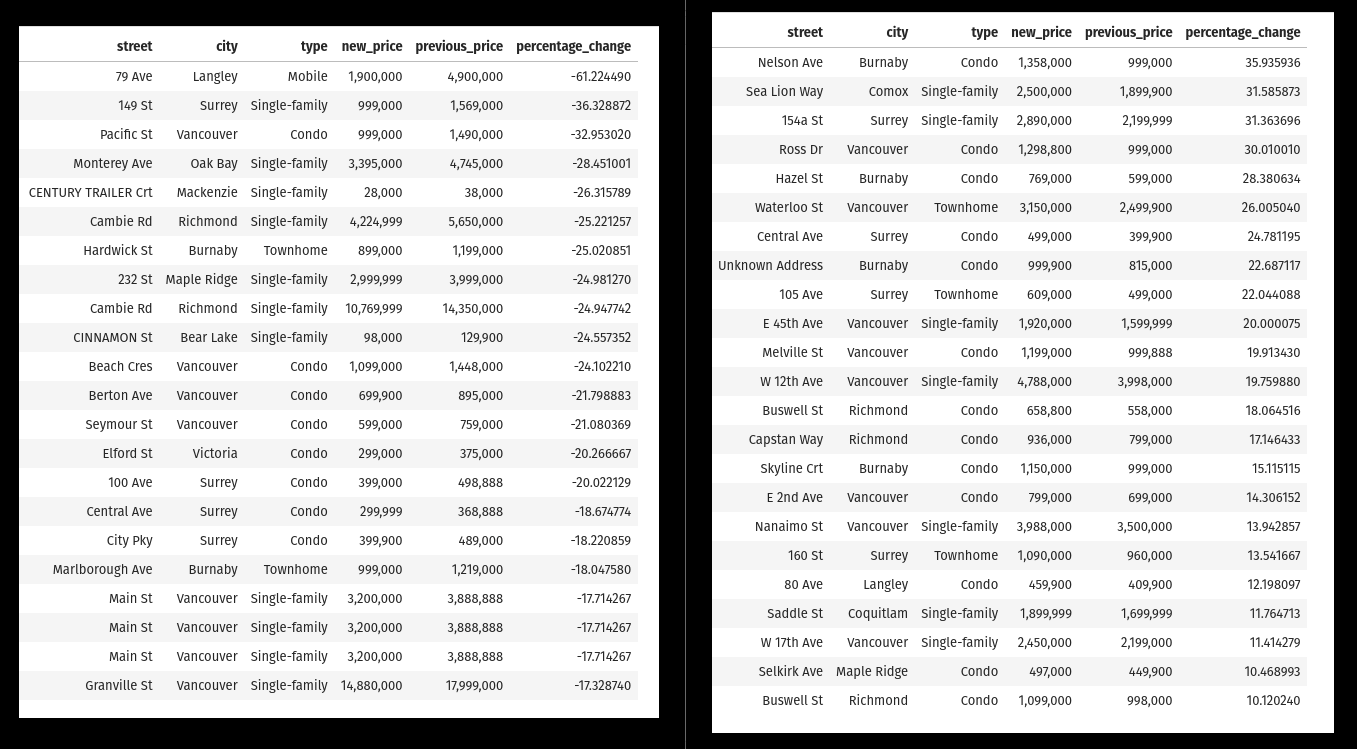
Outlier Breakdown: Additionally, a table will highlight the specific streets where these outliers are located, along with the property type and the nature of their price changes. This transparency will clarify which properties were excluded from our main analysis to maintain accuracy.
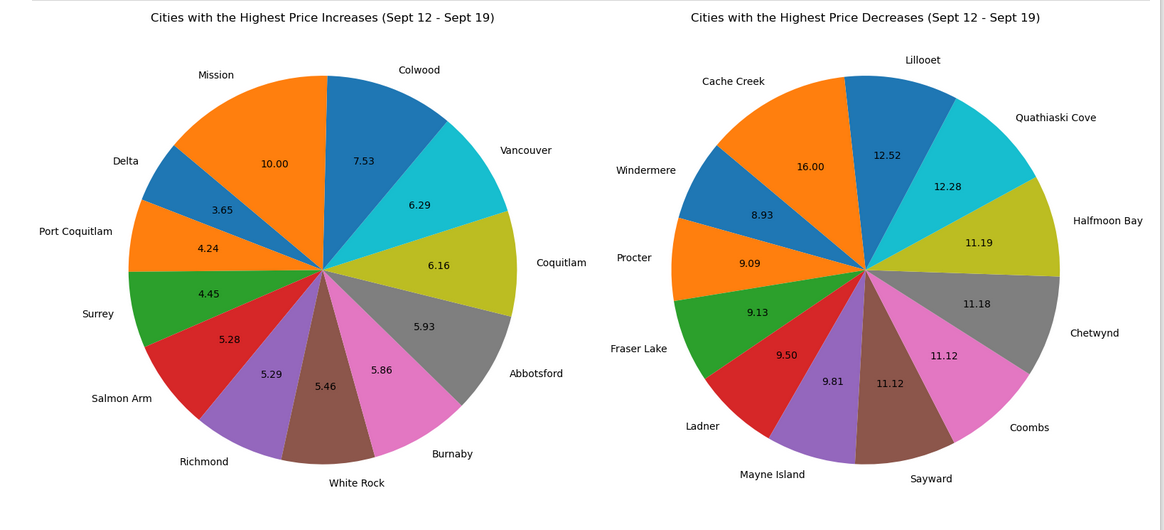
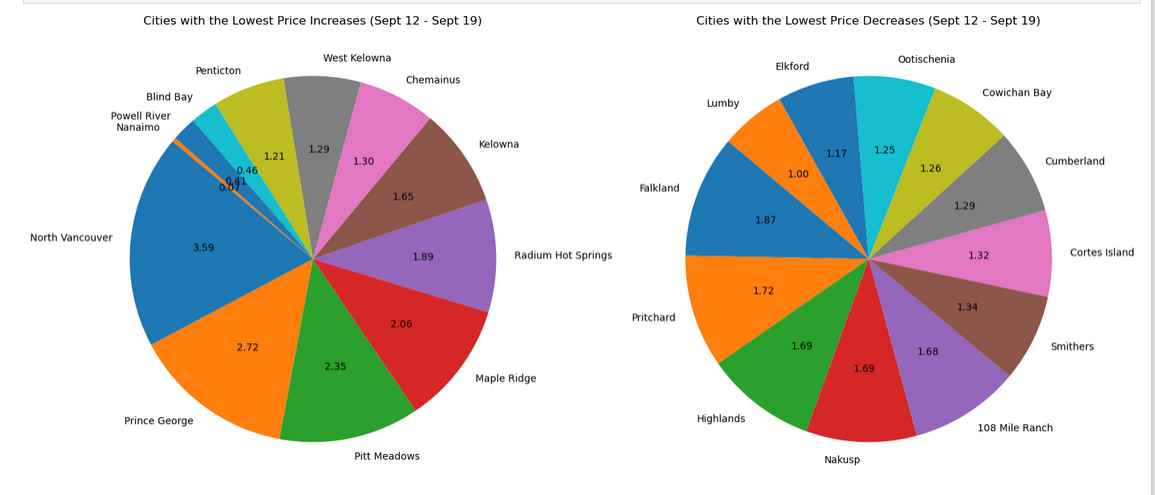
Price Change Outliers: Increases and Decreases by Location
Now in the next four charts, we focus on highlighting the cities with the most significant percentage changes in listing prices. We display two separate charts for the top cities with the highest price change and the cities with the lowest price change in listing. Similarly, for price decreases, we present the cities with the largest and smallest drops.
The properties categorized as outliers will not be used in the pie charts for price trends, ensuring that the final analysis is more accurate and reflective of the general market. Removing these extreme cases allows us to focus on the more consistent trends across BC property listings.
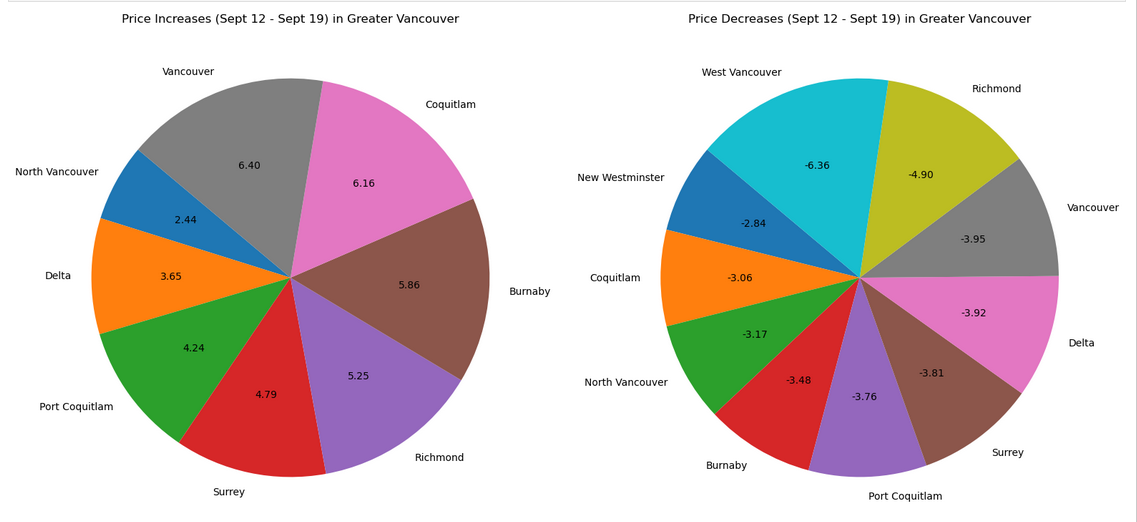
Price Trends in Greater Vancouver: A Focus on Key Urban Areas
Next, we shift our analysis to Greater Vancouver, focusing specifically on key cities such as Vancouver City, Burnaby, Richmond, Coquitlam, Delta, New Westminster, Port Coquitlam, North Vancouver, and West Vancouver. In this section, we will explore the percentage changes in listing prices across these cities, providing a clearer picture of how price trends changed in this urban region
Conclusion:
This week’s analysis, covering September 12 to September 19, highlighted some interesting market trends across Greater Vancouver. I’ll continue this analysis on a weekly basis, providing fresh insights on how the market evolves. Additionally, by the end of September, I’ll conduct a more detailed comparison of property prices and transaction trends between August and September. Stay tuned for next week’s update!


Or